Is 55kg CO₂ good or bad? The case for carbon fluency
DuPont’s vice president of sustainability, Scott Collick, on the need to make carbon as comprehensible as calories
This blog was originally published here on October 13th
 Over the past three weeks, I’ve had the privilege of speaking at three sustainability conferences.
Across all the panels, breakout sessions, and hallway conversations, one topic consistently sparked the most curiosity and conversation: carbon fluency.
I challenged sustainability professionals to think differently – not just about data collection and reporting, but about the meaning behind the numbers.
What do they actually mean?
Can we interpret them intuitively?
Can we communicate them clearly and compellingly?
To make the point, I used two everyday examples: A Chili’s Bacon Rancher hamburger, fries and a Coke; and an iPhone 17.
Most people in the room could reasonably guess the calories in the Chili’s meal (they’re displayed at about 2,310 calories, or about 92 – 116% of the average adult’s full-day requirement).
That’s because we’ve built calorie fluency over decades. We intuitively understand what a burger, fries and soda mean in terms of energy intake.
But when I asked them to estimate the carbon footprint of the iPhone 17 – its Scope 1, 2, and 3 emissions – nearly everyone struggled. Even seasoned sustainability professionals hesitated. And those few who ventured a guess were often off by an order of magnitude.
For reference: the iPhone 17 has a total carbon footprint of 55 kg CO₂e, based on Apple’s iPhone 17 Product Environmental Report.
To put that in context, here’s how it compares to other activities:
- A typical gasoline car emits ~0.25 kg CO₂e per mile. Driving 220 miles = ~55 kg CO₂e — the same as the iPhone 17’s footprint.
- The average US household emits ~50 kg CO₂e per day from electricity, heating, and cooking. The iPhone 17’s footprint is roughly equal to one full day of household emissions.
- Washing and drying a load of laundry with a standard machine emits about 2.4 kg CO₂e.→ 55 kg CO₂e = ~23 loads of laundry — nearly a month’s worth for a typical household.
- A typical adult exhales approximately 0.9 to 1.0 kg of CO₂ per day through normal breathing. This varies slightly based on activity level, body size, and diet. The iPhone 17’s footprint of 55 kg CO₂e is equivalent to ~15–17% of a person’s annual respiration emissions
- A Chili’s Bacon Rancher meal (burger, fries, Coke) = ~5.8 kg CO₂e. The iPhone 17’s footprint is ~10x higher than this restaurant meal.
But the real challenge came next: I asked about the iPhone 17’s 55 kg CO2e footprint, “Is that good or bad?”
Silence.
This is the heart of the issue. We’ve spent years building frameworks, disclosures, and dashboards, but we haven’t built carbon fluency. We know how to count carbon, but we don’t yet know how to talk about it in a way that’s intuitive, relatable and actionable.
Three Dimensions of Carbon Fluency
To build true carbon fluency, we need to look at emissions through three distinct lenses: time, context and impact.
These perspectives help us move beyond raw numbers to meaningful insight and informed action.
- Year-over-Year Comparison A product’s footprint should be evaluated against its own historical performance. Has it improved? Has the company reduced emissions through better materials, processes, or logistics?
- Comparison to Alternatives How does the product stack up against others in the same category? A footprint of 55 kg CO₂e might be excellent for one product type and poor for another. Benchmarking matters.
- Handprint Value This is the game-changer. A product might have a higher footprint but deliver greater avoided emissions – its handprint. That’s where the iPhone example shines.
Year-Over Year Comparison
For the iPhone 17 example, year-over-year comparison is very impressive. The iPhone 16 with the same level of storage (256 GB) had a total carbon footprint of 61 kg CO2 from Apple’s iPhone 16 Product Environmental Report. So the iPhone 17 is 10% better on a year-over-year basis. This kind of year-over-year improvement is one of the most important dimensions for assessing whether we are truly making progress toward net zero.
Comparison to Alternatives
When we compare the iPhone 17 to competitive alternatives like the Samsung Galaxy S25 we see an area for improvement. From Samsung’s Galaxy S25 Product Environmental Report, it has a total carbon footprint of 46 kg CO2, approximately 16% better. It’s essential to always look at both direct competitors and not-in-kind alternatives to understand how a product stacks up in terms of carbon performance.
But carbon footprint alone doesn’t tell the full story. We also need to consider why the product exists, the positive impact it delivers to human health, safety, and productivity, and the emissions it helps avoid.
Handprint Value
The iPhone has replaced more than 20 devices — cameras, GPS units, MP3 players, calculators, alarm clocks, torches and more. Each of those had its own footprint. By consolidating them, the iPhone delivers a massive handprint, reducing emissions across manufacturing, use and disposal.
This is the hardest comparison to quantify, but arguably the most important when evaluating whether a product is truly accelerating progress toward net zero.
Carbon fluency isn’t just about memorising numbers. It’s about understanding context, comparing trade-offs, and making informed decisions. It’s about knowing whether 55 kg CO₂e is better than the industry average, worse than last year, or aligned with a net-zero pathway.
A product’s carbon footprint is not a standalone metric. It must be interpreted through:
- Time (year-over-year progress)
- Context (comparison to peers)
- Impact (handprint and avoided emissions)
This is the essence of carbon fluency — the ability to think critically and holistically about carbon, not just count it. It also means being able to answer the fundamental question: Is it good or bad? Not just in absolute terms, but relative to alternatives, trends and context.
Translating business fluency into carbon fluency
In business, we’re trained to understand the relationship between price, cost, and value. These three elements drive decisions, shape strategy, and determine success.
- Cost = what it takes to make something.
- Price = what the market will pay.
- Value = what the customer gains.
This fluency is second nature to business leaders. But in today’s climate-driven economy, we need a new kind of fluency – carbon fluency. Just as price, cost, and value are interdependent, so too are:
- Footprint = the emissions caused by a product’s production, use and disposal.
- Handprint = the emissions avoided because of the product’s use — its positive impact.
- Sustainability Value = the net benefit to society and the environment, especially when compared to alternatives.
Just as price, cost and economic value shape business decisions, footprint, handprint and sustainability value versus alternatives must guide carbon fluency. This is the sustainability equivalent of business fluency. And it’s just as critical.
If we want sustainability to scale, we need to make carbon as familiar as calories. We need to help our teams, our suppliers, and our customers speak carbon fluently.
We don’t need everyone to become carbon accountants, but we do need to reach the same level of fluency we have with calories: a quick grasp, a gut sense, an informed choice.
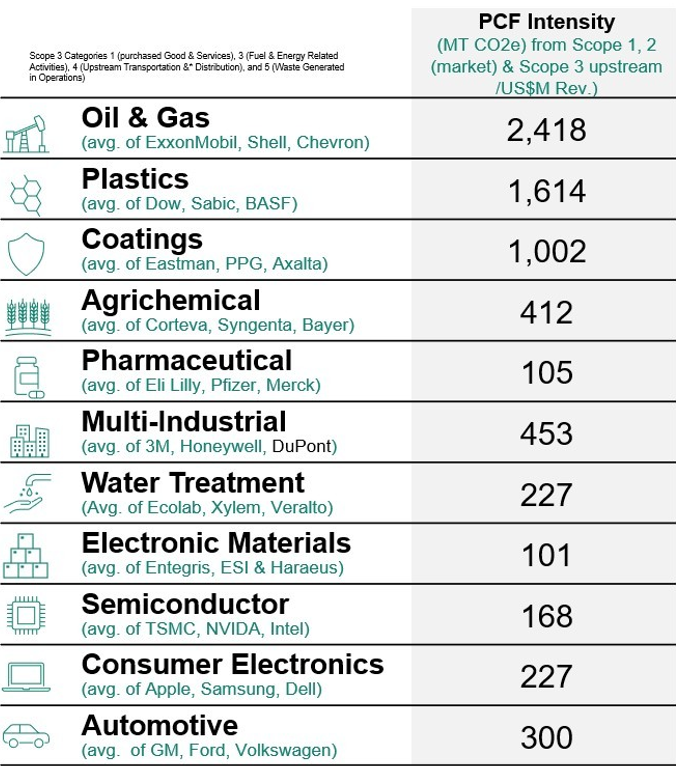
Product Carbon Footprint Intensity
Tradition life cycle assessments, product carbon footprints (PCF) and environmental product declarations often report the kg CO₂e per kg of product.
While intuitive for commodities or single units, this can obscure meaningful progress in diversified, multi-industrial portfolios.
A simple weight-based metric treats a ton of low-value bulk chemical the same as a ton of high-performance specialty material, even if the latter enables massive downstream savings or commands far higher economic value.
That’s why some companies are shifting to PCF intensity, expressed as metric tons CO₂e per million dollars of revenue (MT CO₂e/$MM).
PCF intensity measures the carbon efficiency of revenue generation: how much CO₂e is emitted for every million dollars sold? It connects sustainability to strategy, linking emissions data to profitability and portfolio mix.
It’s a smarter, strategy-aligned measure for a portfolio because:
- It allows apples-to-apples comparisons across very different products, business units and peer companies.
- It reveals portfolio improvement, even if total production grows or mix shifts.
- It ties decarbonisation directly to business performance, helping leaders focus where reductions matter most.
Back to the iPhone 17, which has a retail price of $799: with the total product carbon footprint (scopes 1, 2, and 3), this translates to $69 MT CO2e/$MM, which is very good relative to the average PCF intensity across other sectors (see image).
Engineers often think in kg CO₂e per kg of product — a precise, process-level view that helps optimise individual formulas or unit operations. But business leaders need PCF intensity, because it’s a portfolio-level metric that links carbon performance to value creation, enabling smarter investment, innovation and mix decisions across the enterprise.
Bringing it together: carbon fluency in action
Carbon fluency is the ability to understand and apply sustainability concepts – especially PCF and handprint – in the same way financial fluency connects cost, price, and value.
By mastering carbon fluency, businesses can make smarter decisions, balance environmental impact with economic value, and position sustainability as a competitive advantage in the sixth wave of innovation.
In short, carbon fluency gives people the language, and PCF intensity provides the scorecard. Together, they turn sustainability from a reporting requirement into a competitive capability — one that helps every function see, speak, and steer toward a lower-carbon, higher-value future.
If we want sustainability to scale, we need to make carbon as familiar as calories.
Scott Collick is the vice president of sustainability at DuPont, and former vice president of technology at the company’s mobility and materials arm. Until this summer, he co-chaired the US National Academy of Sciences’ board for chemical sciences and technology. Scott has a degree in chemical engingeering and a masters in business administration in finance.